Many Mona Lisas? Artistic Data Quantification and Assessment
cc-dataviz collaboration community quantifying-the-commonsQuantifying the Commons
University of Michigan, School of Information
Project Objective and Problem Statement
Creative Commons (CC) has over one billion licensed works. However, there is no central data or organization of CC’s licensed works, making it difficult to quantify the number of works and to analyze which licenses are useful or should be retired. The goal of this project is to help CC staff identify redundant licenses and use quantitative data in marketing its impact. It focuses on Open Education Resources (OER).
Data Collection
Data was collected from OER Commons, which is one of CC’s platforms and a library containing digital education resources. The first step in data collection was identifying which licenses this data source uses and how many works are under each license within OER Commons. OER Commons uses the licenses CC-BY, CC-BY-SA, CC-BY-ND, CC-BY-NC, CC-BY-NC-SA, and CC-BY-NC-ND which contribute to both ‘fair use’ and ‘commercial use’ assets, respectively. The next step in data collection was querying the Application Programming Interface (API) by license. In order to retrieve all works for a license, queries are batched by a maximum of 50 works retrieved at once. This process is repeated until all works for a license are retrieved. These steps are run for every license. For every API call, the response is in XML which is parsed for features including education level, subject area, material type, media format, languages, primary user, and educational use. The results are outputted to a tab-separated CSV file.
Exploratory Data Analysis (EDA)
After collecting all of our data, we began exploring the different columns in our dataframe. In particular, we looked at the distribution of different languages, the distribution of items by license type, and when items were added to the OER Commons API. Through this exploration, we were able to further specify our analysis and dig deeper into the different relationships of the data.
Diagram #1:
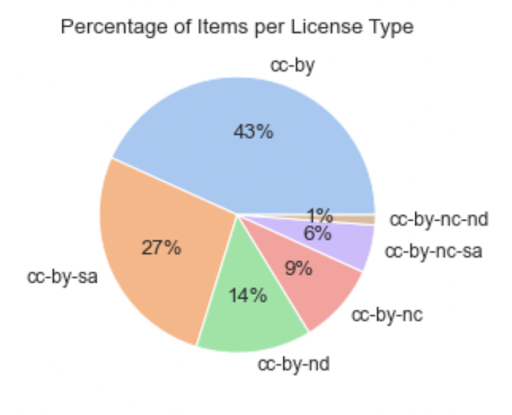
Diagram #1 shows the distribution of items taken from OER Commons by license type. It is clear that the CC-BY license type is the most popular, with 43% of the items having that license type. The CC-BY-SA license is also fairly popular, accounting for 27% of the items collected.
Diagram #2:
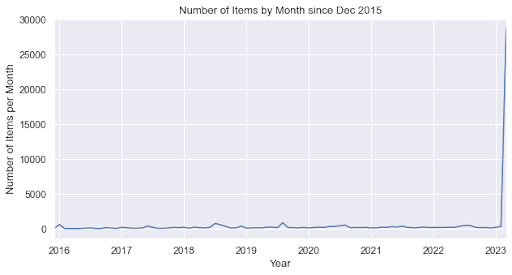
Diagram #2 shows when items have been added to the OER Commons API. There is little activity from December 2015, up to the beginning of 2023. However, close to 30,000 items were added to the API in early 2023.
Diagram #3:
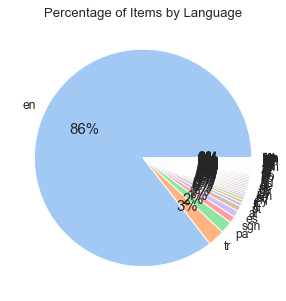
Diagram #3 shows the percentage of items by language. English is the most used language, with about 86% of the items being in English. The other languages each have a small amount of the items.
Diagram #4:
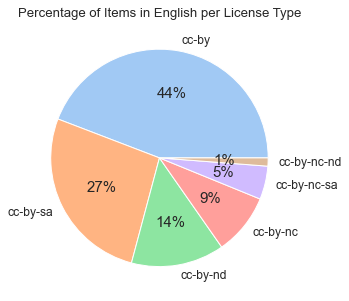
Since English is clearly the most popular language, we decided to see the license distribution for items that are in English. Diagram #4 shows a similar distribution to the pie chart depicting the overall license distribution; this is to be expected since items in English account for 86% of all items, so the distribution of licenses is similar to the overall distribution.
Diagram #5:
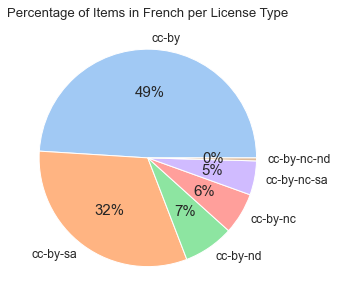
We continued to look at the distribution of licenses by each language. Diagram #5 shows that for the items in French, CC-BY license is the most popular at 49%, with CC-BY-SA being right behind it at 32%.
Visualizations
Diagram #6:
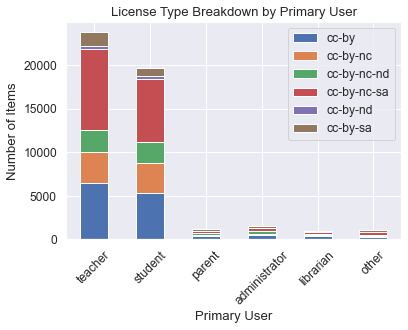
Diagram #6 shows the distribution of items on OER commons by primary user and broken down by license type. The platform predominantly contains items designed for teachers and students, with the rest for parents, administrators, librarians among others. The breakdown of licenses for each primary user is relatively consistent with the overall breakdown of the platform, as seen from the charts below (Diagram #7 and Diagram #8).
Diagram #7:
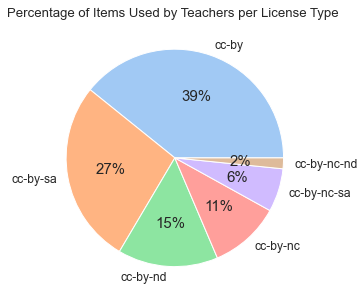
Diagram #8:
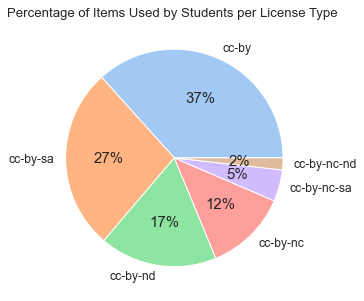
Diagram #9:
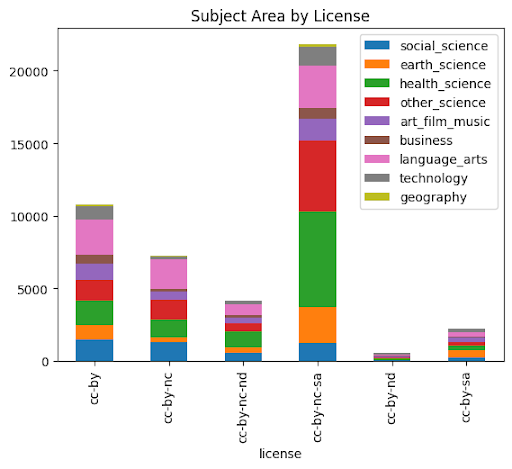
Another aspect analyzed was inspecting the subject areas and the licenses that they hold as shown in Diagram #9. Some preliminary data cleaning had to be conducted as there were too many subjects on the platform, while some subjects had very low counts. The team grouped similar subjects into nine different categories, for example, social science, anthropology, sociology, communication, world cultures, psychology, women’s studies, and social work were grouped into social sciences.
It can be seen from Diagram #9 that the most popular subject areas on the platform are health sciences, language/arts and other sciences. Diving deeper into these subject areas, health sciences and language/arts have a higher proportion of items with the CC-BY-NC-SA license.
Diagram #10:
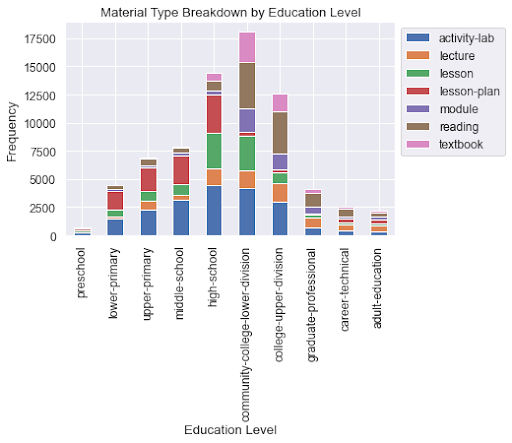
Finally, the team analyzed the material types of the items and sorted it by education level that the items were created for. Again, some data cleaning was required as there were too many material types to analyze and some also had very small data counts. The seven material types shown in Diagram #10 were the most popular, and represented roughly 2/3 of the total.
After sorting the education levels in chronological order, an interesting trend that emerged is that the number of items increases with education level from preschool, hits a peak at the community college level, and then decreases afterwards. A shift in the material types can also be drawn from the graph, as lesson plans represent a large proportion of items from preschool to high school, but become insignificant from the college level onwards. On the other hand, this is replaced by a higher proportion of readings. Another observation worth remarking is that there is also a higher proportion of items at the college level for textbooks.
Key Value
The insights created through the analysis of this project will be helpful for CC’s marketing efforts. The ability to understand the distribution of license types in different contexts such as education level, will help CC be better equipped to target their marketing toward key demographics such as preschool education materials for example. Another take away in terms of key value was CC’s initiative to long term preservation. CC’s need to centralize their collaborators' content into a database warehouse system has been an identified direction since the start of this project. Our prototype database of the OER Commons has contributed to these efforts in both small scale implementation as well as meeting the scope of our database system modeling. As other CC cohort chapters contribute their own databases of licenced works, there is a hopeful expectation that a merger of acquisition will take place with other CC chapters in the future.
Next Steps
As CC expands its contributing members into the open-source initiative of bringing licensed works to the world, other internal systems of data preservation and maintenance start to become a point of serious interest as the databases start to become an integrated endeavor in the future. Running our prototype case study of the OER-Commons database has given us insights on the direction of CC current database system and how this system will be better suited to evolve into a data warehouse hub as a long-term solution. When we started the process of data mining and data analysis, using Python3 has been a staple in both our groups efforts as well as CC’s previous protocols with Git. So, complementing this framework with other Python libraries that allow for easier database querying will be a step in the right direction for the next cohort of CC contributors to further this process along. An example of this library integration would be pandasql to utilize the family pandas library methods along with the SQL command logic that makes database maintenance easy and manageable. Besides updating the data storage, future work can continue to collect data from other sources with CC licensed work including the GLAM and Internet Archive.
Acknowledgements
We would like to express our gratitude towards Timid Robot Zehta, our client, for working on behalf of CC, as well as OER Commons for their valuable contributions towards the development of digital licensing and open source databasing initiatives. Without them, this project would not have been possible. Their efforts have been instrumental in giving us the tools and resources to help progress in the open-source initiative by allowing us to promote the free exchange of ideas, knowledge, and resources within the art, health, and education sectors of non-profit endeavors. Open source projects are important because they allow the public to use and work on projects without restrictions or keys. Since this initiative is open source, our efforts can be added to and built upon, allowing the project to continue through the addition of new contributors with fresh perspectives. Both of their commitment to promoting accessible and inclusive content has enabled individuals and organizations to create and distribute digital assets without facing any legal restrictions around the world. It has been an absolute pleasure to work with these organizations and be a part of their mission to democratize access to information.