Data Science Discovery: Quantifying the Commons
cc-dataviz collaboration community quantifying-the-commonsUniversity of California, Berkeley, Data Science Discovery Program Fall 2022
Project Objective
Problem Statement
In the previous years, from 2014 to 2017, Creative Commons (CC) have been releasing public reports detailing the growth, size, and usage of Creative Commons, demonstrating the significance and influences of Creative Commons. However, the effort to quantity Creative Commons has ceased at the proceeding year. This is the preincarnation of our current open-source project: Quantifying the Commons.
An example visualization from the previous report in 2017:
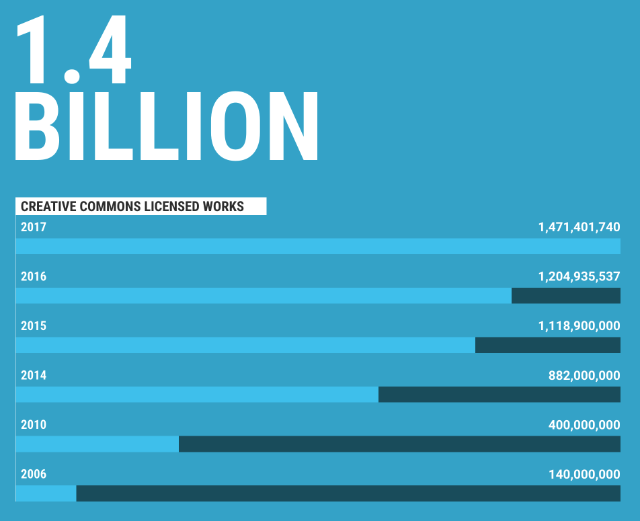
The reason is that prior efforts to generate usage reports suffered unreliable data retrieval methods; while prone to malfunction over the updates of website architecture from data sources, these data extraction methods are not particularly rigorous in performance and have a significantly low (compared to current methods, at the scale or an hour v.s. 5 business days).
To advance and continue the work of quantifying CC product states, the student researchers are delegated the design and implementation for reliable data retrieval processes on CC data that were employed in previous reports to replicate past efforts of this project's preincarnation, quantify the size and diversity of CC Product Usage on the Internet.
Data Retrieval
How to detect county of CC-Licensed Documents?
If an online document uses a CC tool to protect it, then it will either be labeled as license under that tool or contain a hyperlink towards a creativecommons.org webpage that explains the license's rules (the deed).
Therefore, we may use the following approach to identify and count CC-licensed documents:
- Select a list of CC tools to inspect (provided by CC).
- Use APIs of different online platforms to detect and count documents that are labeled as license by platform and/or contains a hyperlink towards CC license webpages.
- Store these data in tabular form to contain the count of documents protected under each type of CC tools.
What platforms to collect counts from?
Here is a list of online platforms that we sampled document count from, as well as the delegations for platforms' data collection, visualization, and modeling in this project:
| Platforms Containing Webpages | Platforms Containing Photos | Platforms containing Videos |
|---|---|---|
| Google (Dun-Ming Huang) | DeviantArt (Dun-Ming Huang) | Vimeo (Dun-Ming Huang) |
| Internet Archive (Dun-Ming Huang) | Flickr (Shuran Yang) | YouTube (Dun-Ming Huang) |
| MetMuseum (Dun-Ming Huang) | ||
| WikiCommons (Dun-Ming Huang) |
Exploratory Data Analysis (EDA)
Here are some significant defects found in datasets across sampled platforms during EDA:
Flickr
- Sampled Document Count from this dataset is at 35,000% ~ 100,000% of deviation from official statistics per CC product (license) investigated.
- Sampling frame locked at 4,000 available searched photos from each license.
- Significant duplication issue (resolved).
Google Custom Search API
- Programmable Search Engine only reaches a subset of Google's website. The impact is not significant (then, further resolved via sampling frame adjustments in PSE).
- Accidentally used deprecated operators and parameters, causing faithfulness problems (resolved).
YouTube Data API
- API has maximum response value on total count of YouTube videos, causing
severe underestimate.
- Resolved via implementing custom granularity on data to enable honest response, conserve development cost, and introduce imputations in visualization.
Expanding the Dataset
Here are reasons and efforts of dataset expansion on platforms that received more data:
Google Custom Search API
- Revised Data Sampling process to solve EDA-discovered inaccuracies.
- For expanding the horizons of CC product usage analyses upon past boundaries, where visualization was only conducted to compare cross-product performance, I incorporated further CC-product usage data across temporal axis and geographical demographics.
YouTube Data API
- Revised Data Sampling process to solve EDA-discovered inaccuracies.
- To perform unprecedented analyses on media-specific time-respective developments of CC options on popular platforms, YouTube's CC-licensed video count across two-month periods.
- Introduced imputation to alleviate unresolvable capped responses from YouTube and mitigate developmental cost in response to Youtube API's capping behaviour.
Visualization
Philosophies and Principles
The visualizations of Quantifying the Commons is to be communicative and exhibitory.
Some new aesthetics and principles we adopted (as a response to enhancement of prior efforts) are to:
- Present length in place of area for comprehensibility
- Analyze product development beyond license-wise comparisons
- Utilize colors for presenting data inclinations via works in Pandas, Seaborn, NumPy, Geopandas, and SpaCy
Exhibiting a Selection of Visualizations
Diagram 1C
Trend Chart of Creative Commons Usage on Google
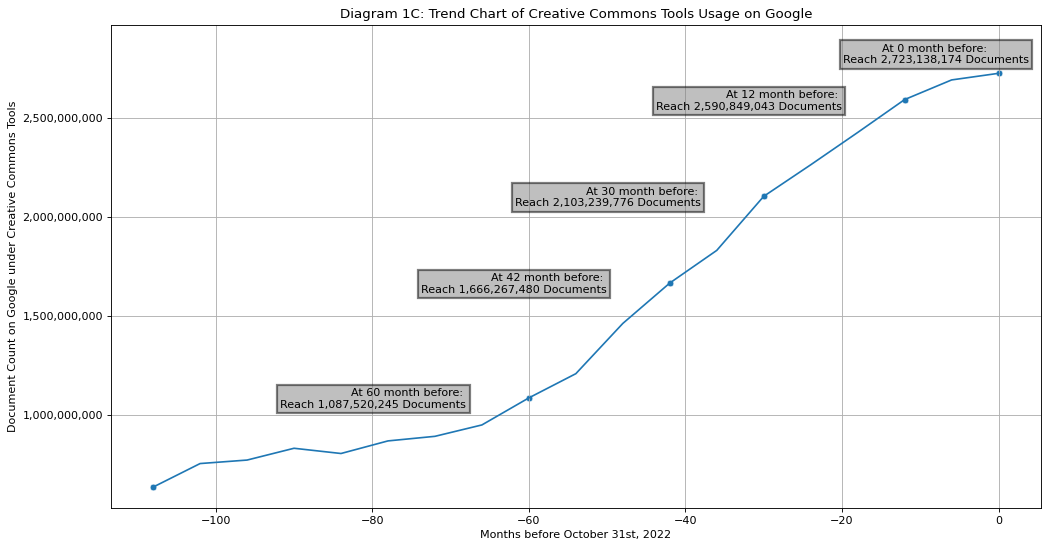
There are now more than 2.7 Billion webpages protected by Creative Commons indexed by Google!
Diagram 2
Heatmap on density of CC-licensed Google indexed webpages over country
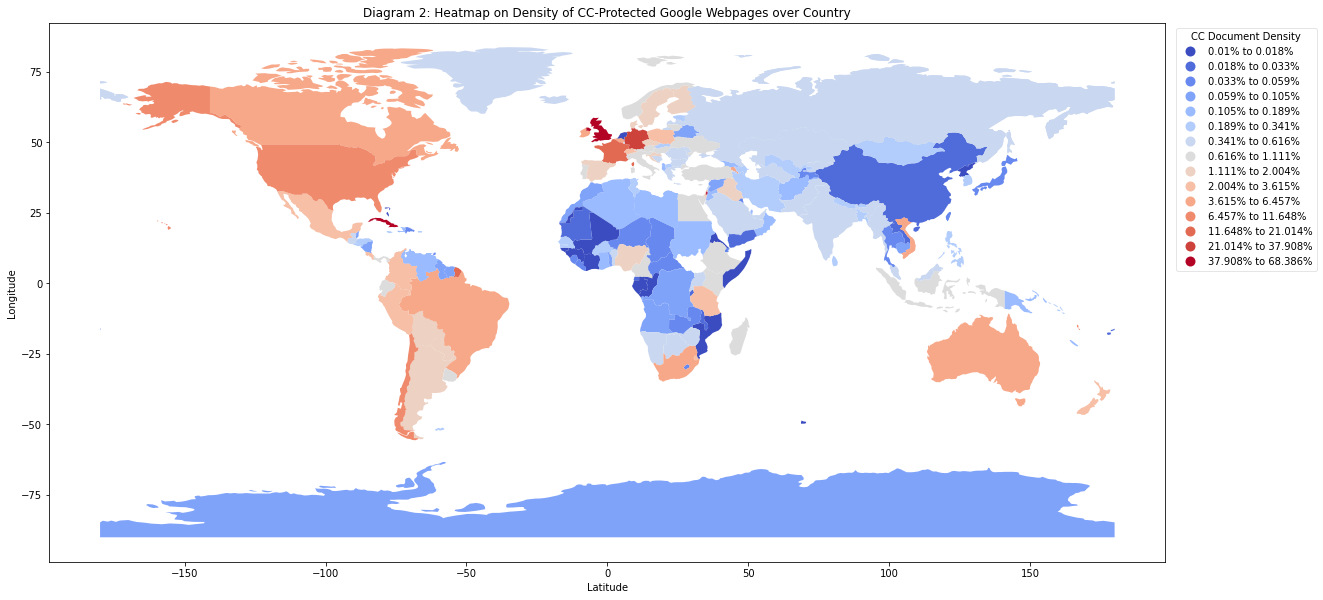
Particularly, Western Europe and Americas enjoy a much robust use of Creative Commons document in terms of quantity. A Development in Asia and Africa should be encouraged.
Diagram 3C
Barplot for number of webpages protected by six primary CC licenses
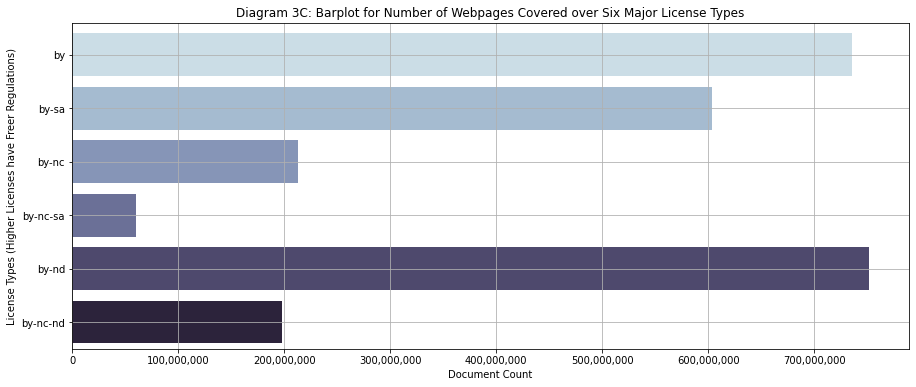
We can see that Attribution (BY) and Attribution-Nonderivative (BY-ND) are popular licenses among the 3 billion documents sampled across the dataset.
Diagram 6
Barplot of CC-licensed documents across Free Culture and Non Free Culture
licenses
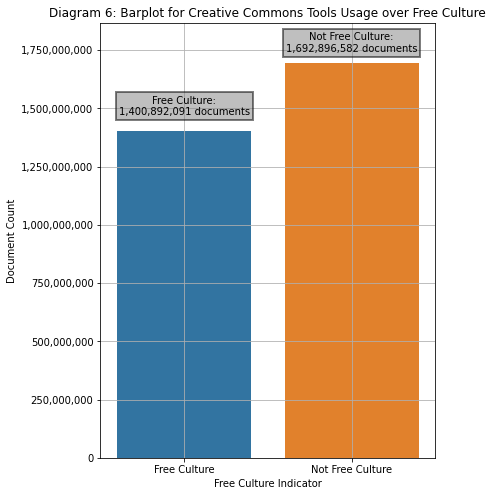
Roughly 45.3% of the documents under CC protection are covered by Free Culture legal tools.
Flickr Diagrams
Usage of CC licenses on Flickr concentrated on Australia, Brazil, United Stated of America while is pretty low in Asia countries.
Note: Sampling Frame of these visualizations are locked at the first 4,000 search results on photos under each general license types.
Diagram 7A
Analysis of Creative Commons Usage on Flickr
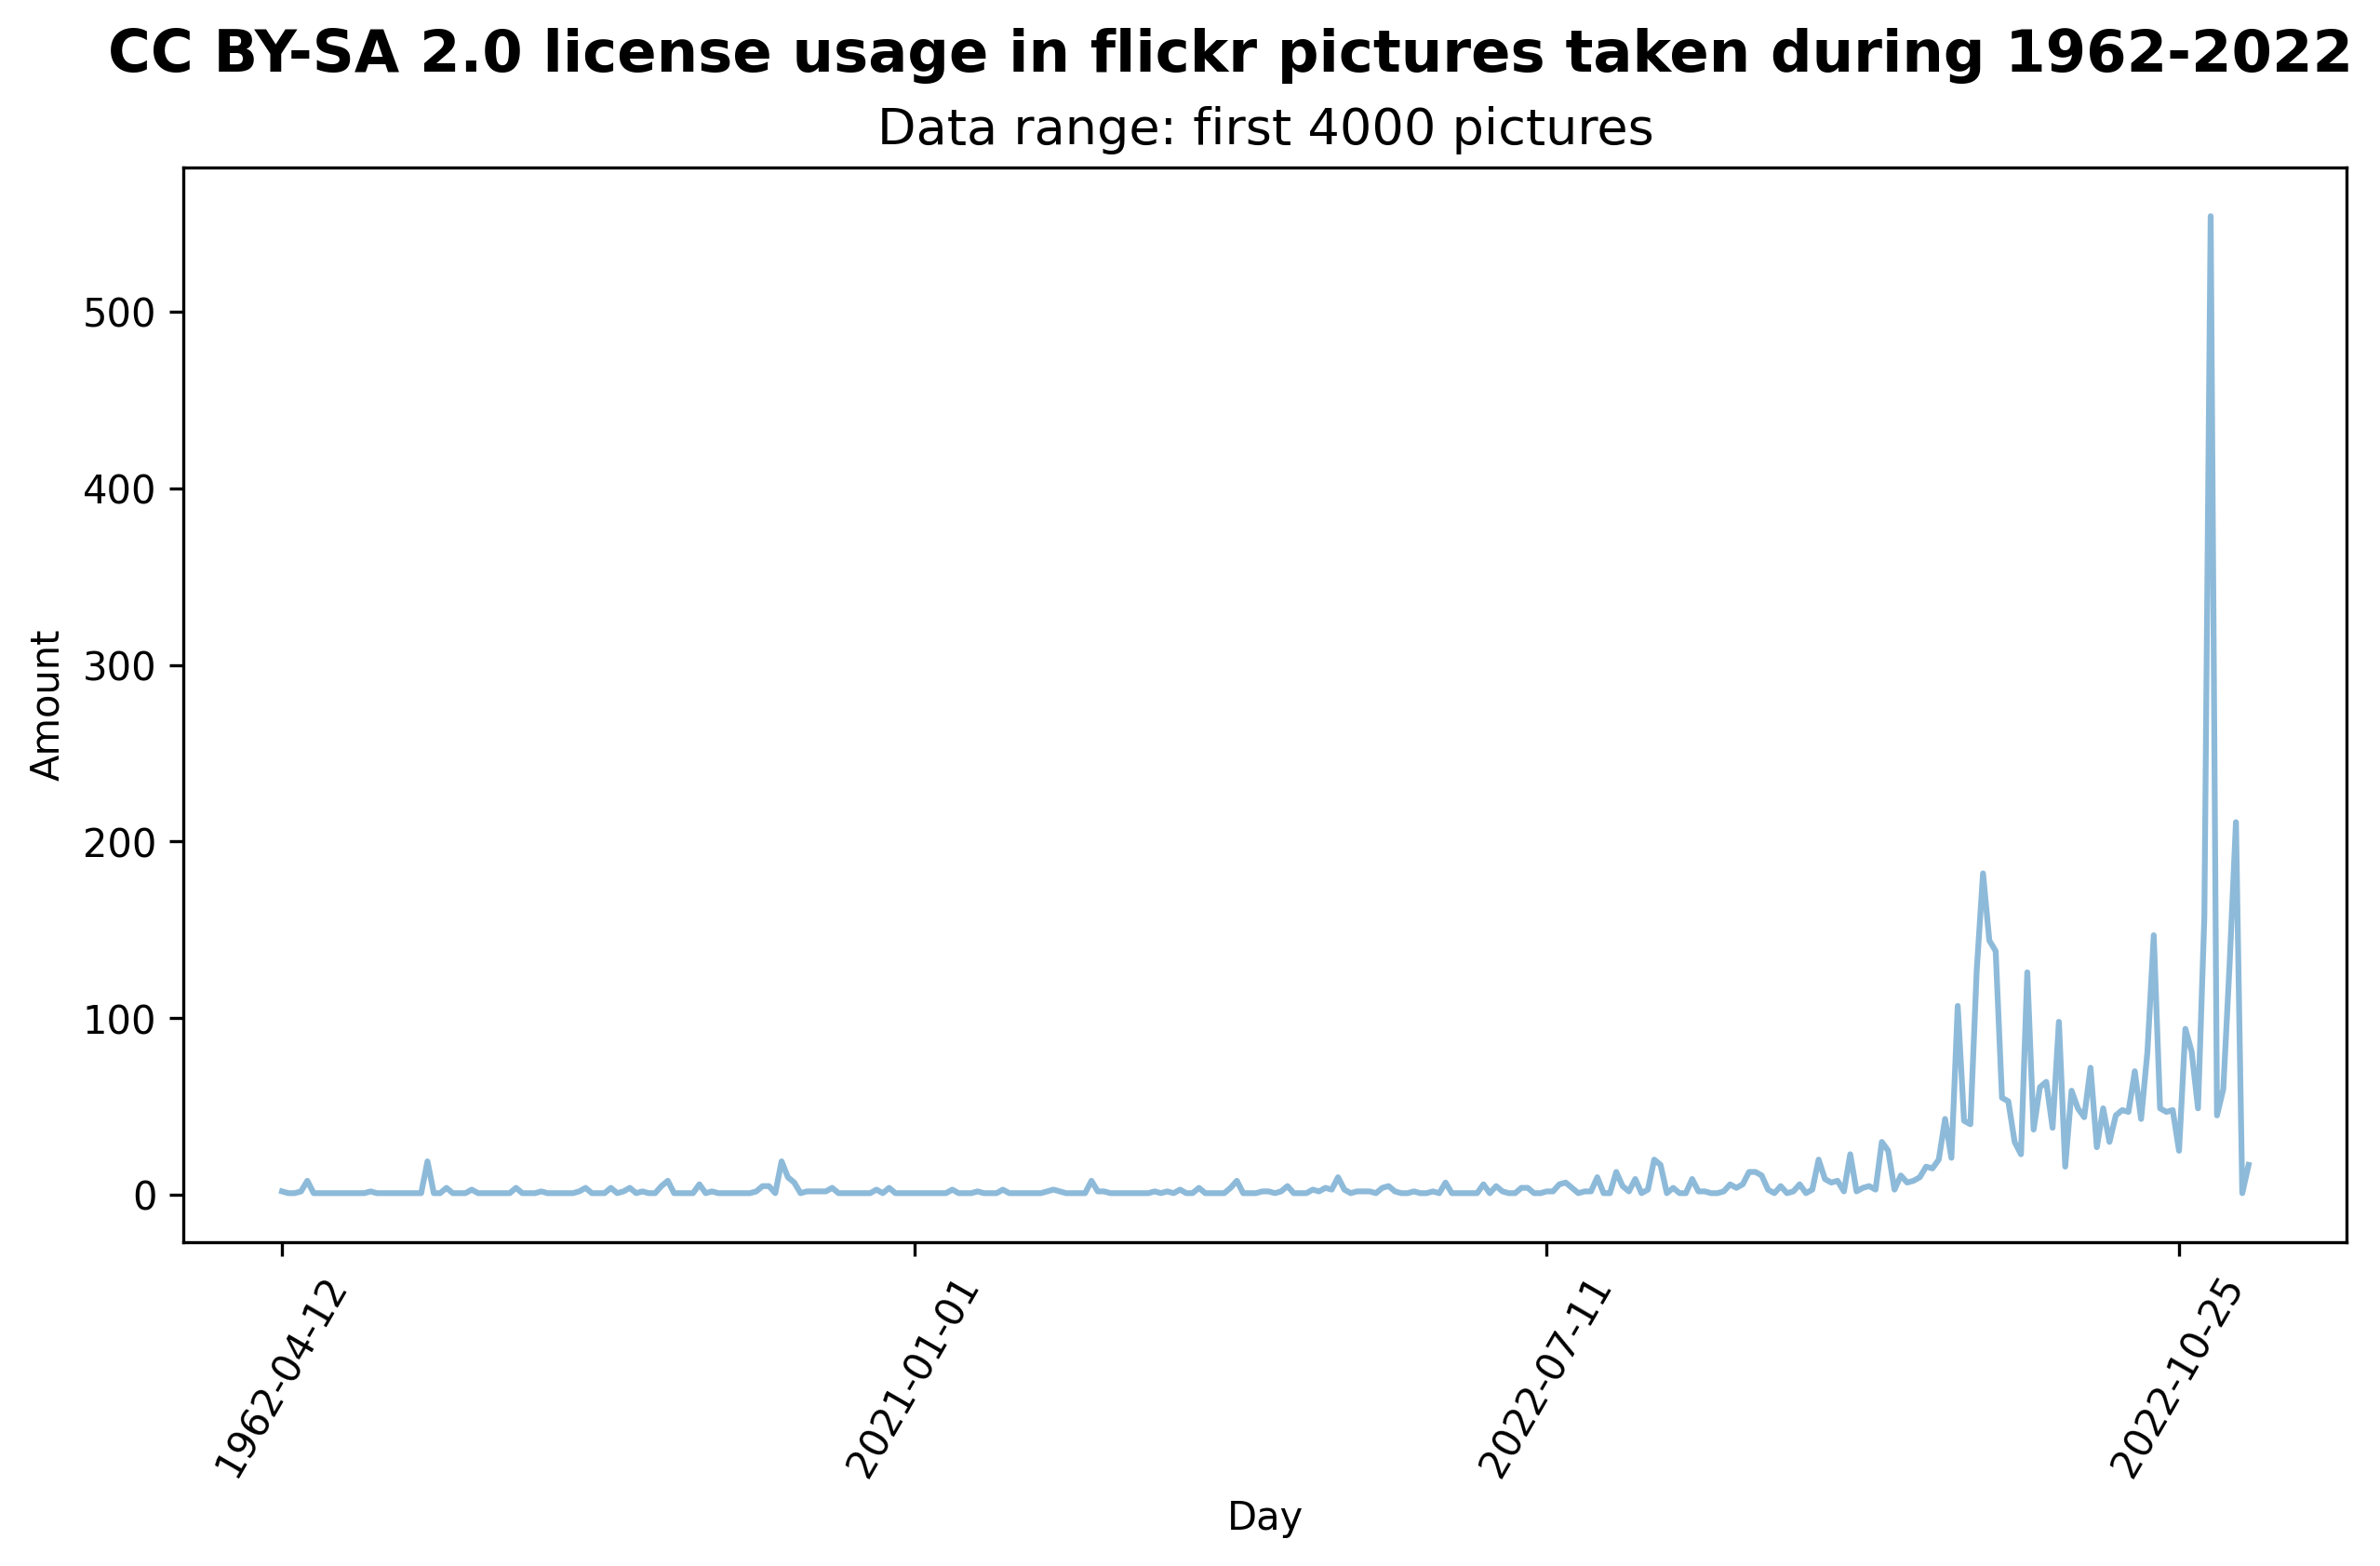
Diagram 7B
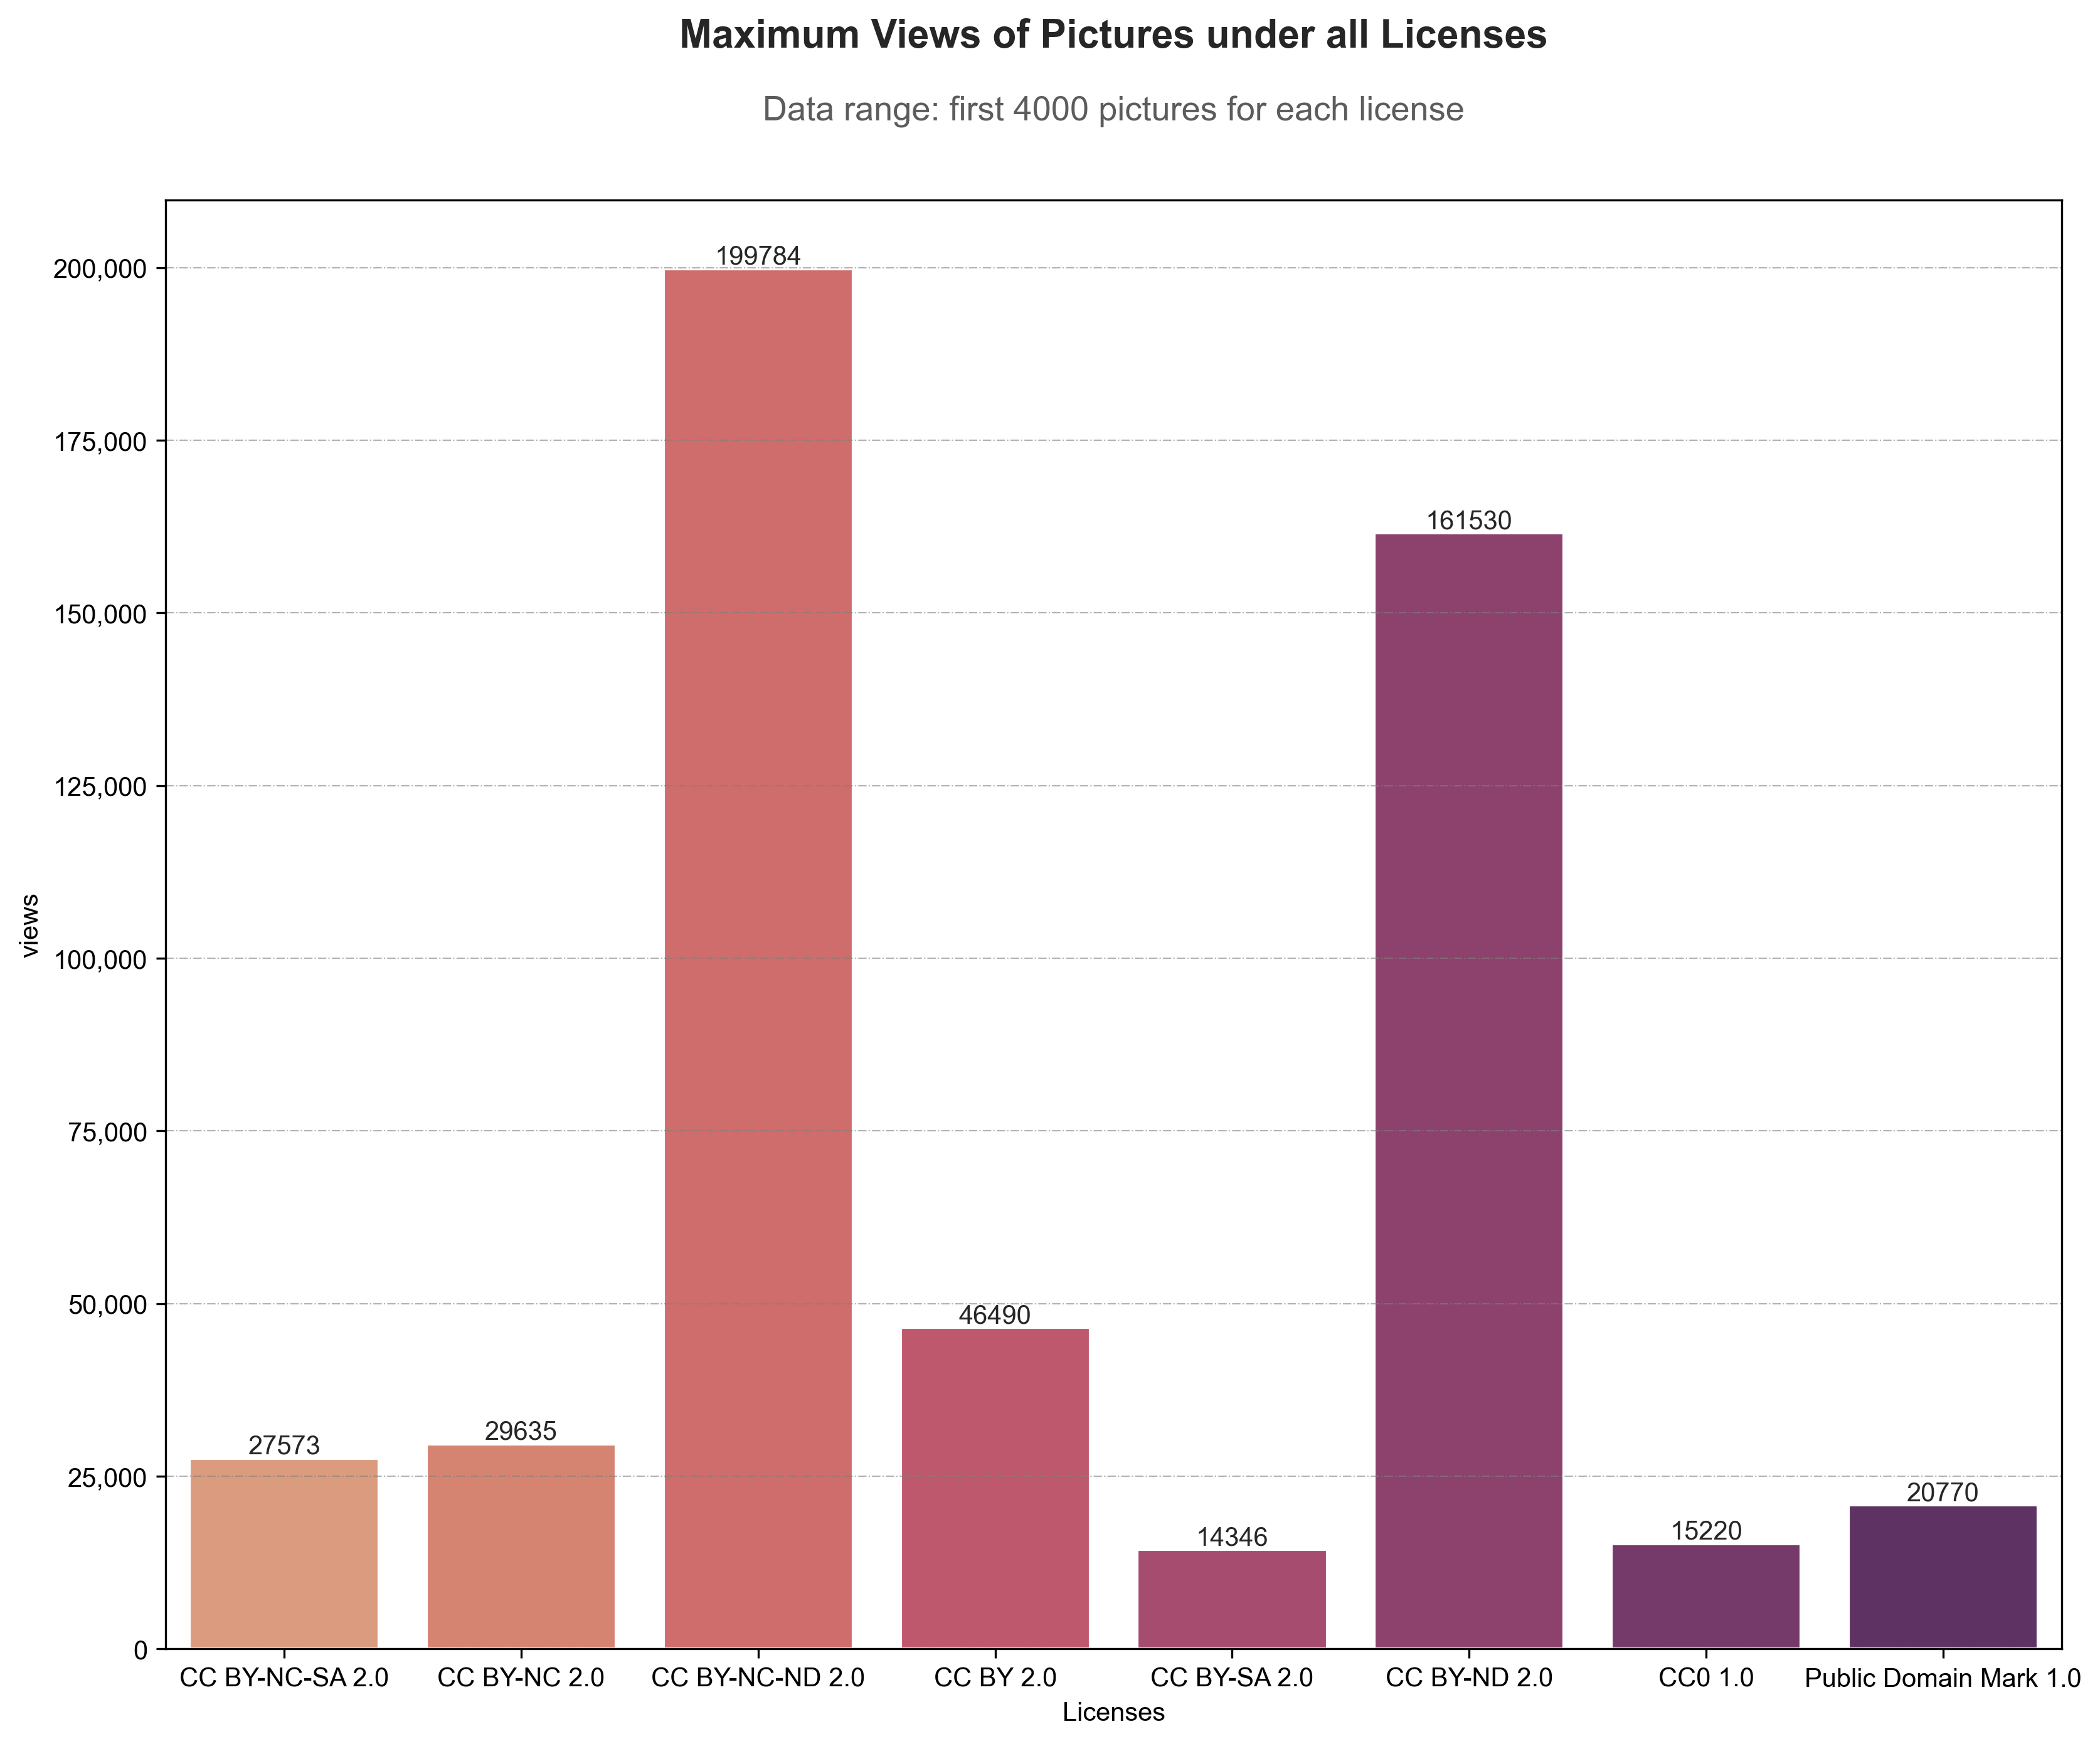
Photos on Flickr under Attribution-NonCommercial-NoDerivs (BY-NC-ND) license has gained highest possible views, while usage of license Public Domain Mark has highest increasing trend in recent years.
Diagram 7C
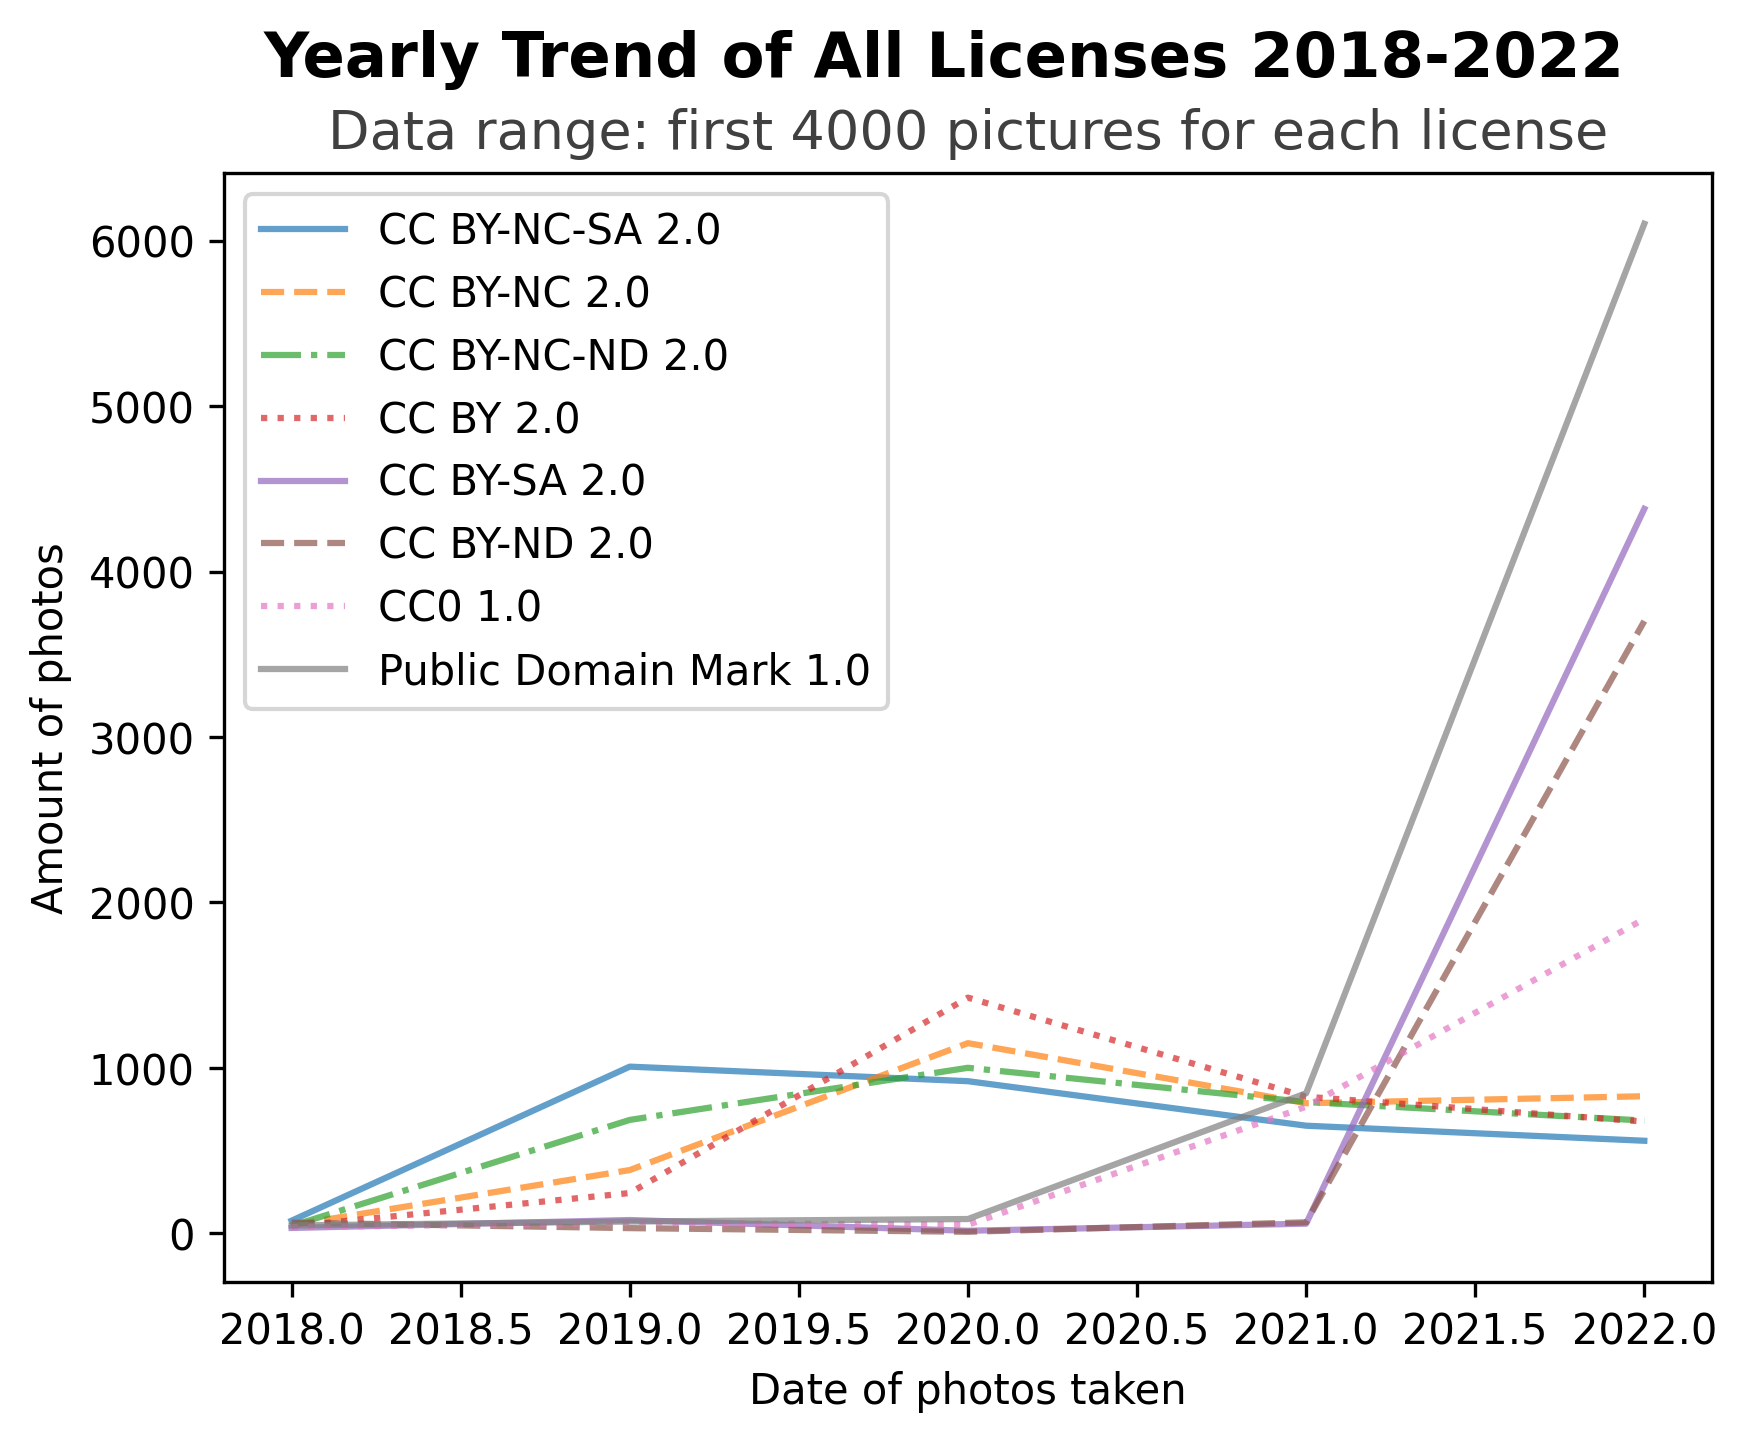
Diagram 7D
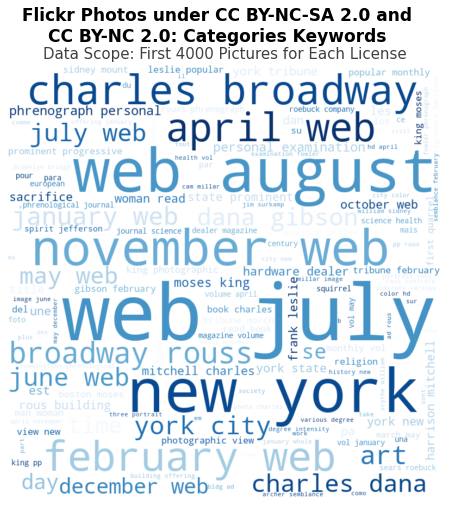
Diagram 8
Number of works under Creative Commons Tools across Platforms
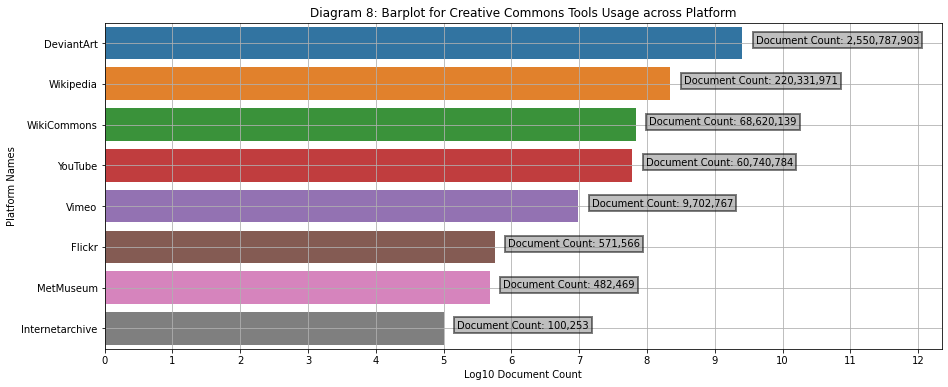
DeviantArt presents the most number of works under Creative Commons licenses and tools, followed by Wikipedia and WikiCommons. The estimate of video counts on YouTube is understimated, as demonstrated in Diagram 11B.
Diagram 9B
Barplot of Creative Commons Protected Documents across Countries
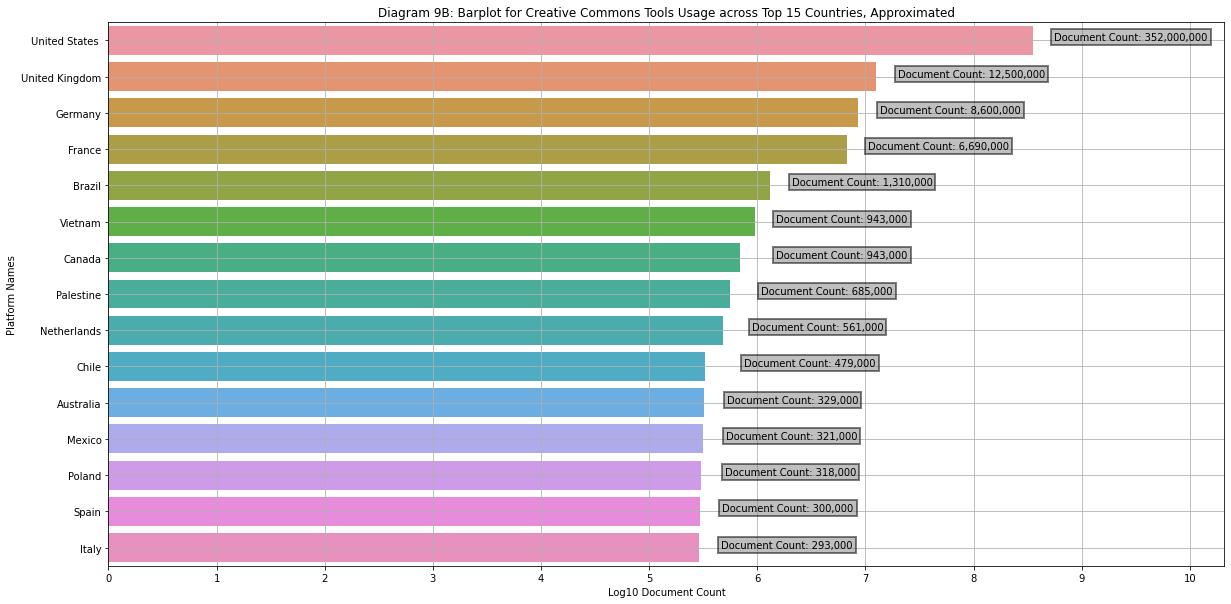
Diagram 10
Barplot of Creative Commons Protected Documents across languages
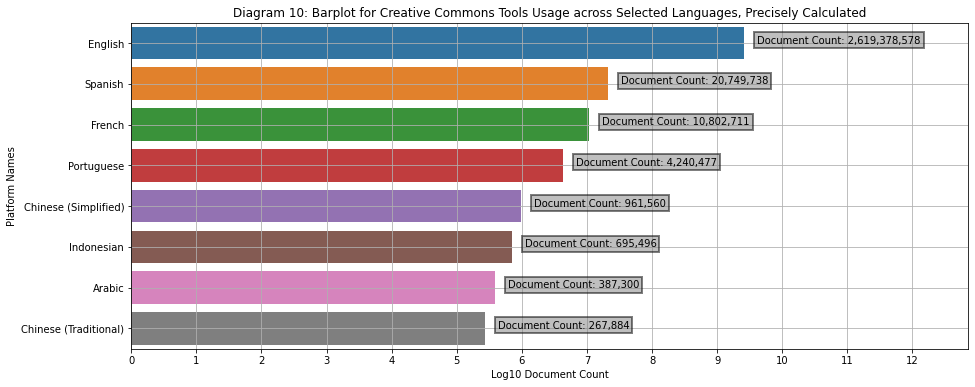
Diagram 11B
Trend Chart of Cumulative Count of CC-Licensed YouTube Videos across Each Two-Months
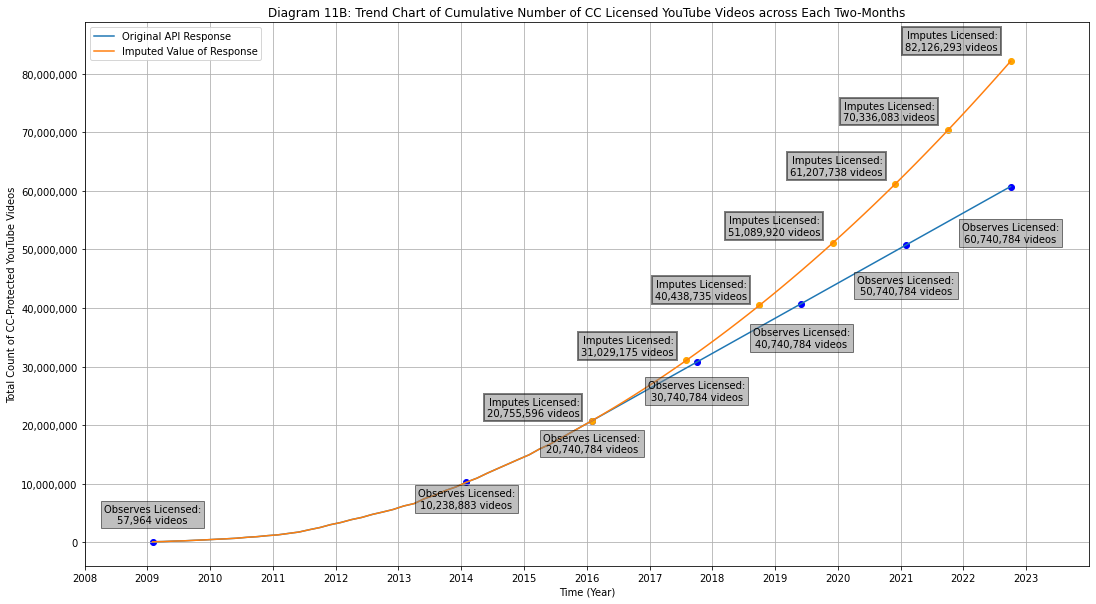
The orange line stand for the imputed value of new CC-Licensed YouTube video counts based on linear regression, which is the decided method of imputation because most medias' growth of CC-licensed document count also experience a linear growth.
Modeling
(A side track)
Objectives of Modeling
The models of this project aim to answer: "What is the license typing of a webpage/web document given its content?"
Individual researchers have attempted each of their solutions via different resources, metrics, under different modeling contexts:
Model of Google Webpages (Dun-Ming Huang)
- Modeling Context: Multiclass Classifier (7 classes).
- Modeling Training set: Text webpage contents acquired from Google API collected webpages (Common Crawl, the original choice, was marked unavailable due to source code corruption).
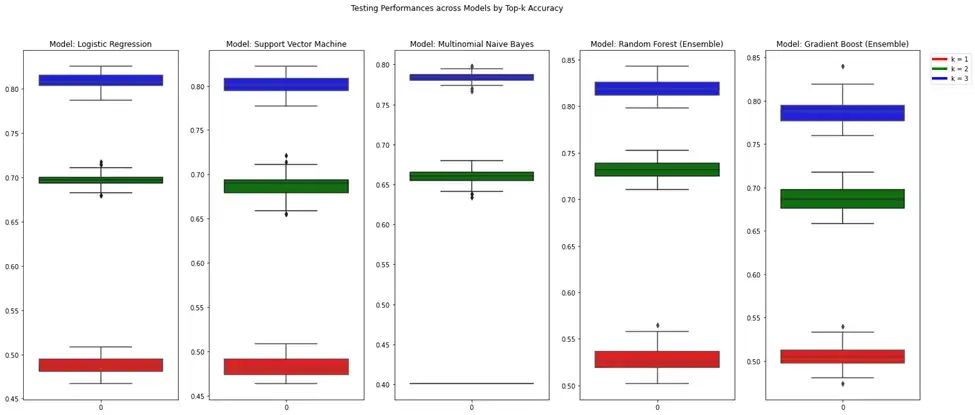
- Main Model Metric: Top-k accuracy, as this model is considered as the backend of a license recommendation system that receives webpage content and recommend 2 to 3 licenses to the user.
Model for Flickr Photos (Shuran Yang)
- Modeling Context: Binary Classifier (BY vs. BY-SA)
- Modeling Training set: Text photo descriptions acquired from Flickr API (with sampling frame of visualizations)
- Main Model Metric: Accuracy
Training Process Summary: Google Model
Preprocessing Pipeline
- Deduplication
- Remove Non-English Characters
- URL,
[^\w\s], Stopword Removal - Remove Non-English Words
- Remove Short Words, Short Contents
- TF-IDF + SVD
- SMOTE
Model Selection
Logistic Regression(
    penalty="l2",
    solver="liblinear",
    class_weight="balanced",
    C=0.1,
)
SVC(
    C=0.5,
    probability=True,
    kernel="poly",
    degreee=1,
    class_weight="balanced",
)
RandomClassifier(
    class_weight="balanced_subsample",
    n_estimators=100,
    random_state=1,
)
GradientBoostingClassifier(
    n_estimators=5,
    random_state=1,
)
NultinomialNB(
    fit_prior=True,
    alpha=10,
)
- text : InputLayer
- preprocessing : KerasLayer
- BERT_encoder : KerasLayer
- dropout : Dropout
- classifier : Dense
Training Results
Training Process Summary: Flickr Model
Preprocessing Pipeline
- Deduplication
- Translation
- Stopword Removal, Lemmatization
- TF-IDF
Model Selection
SVC(
    C=1.0,
    kernel="linear",
    gamma="auto",
)
Training Results
An accuracy of 66.87% was reached.
Next Steps
From Preincarnation to Present
Via the efforts addressed above, we have not only managed to transform a data retrieval process from unstable, unexplored, and unavailable into an algorithmic, deterministic process reliable, documented, and interpretable! And the visualizations have become more exhibitory, concentrating on more effortfully extracted insights, and look at Creative Commons in further depth and more remarkable breadth.
With significant re-implementations and designing policies to the data retrieval process for Quantifying the Commons, visualizations can be readily, immediately produced upon command; and upon the conceptual transformations of visualization production, Creative Commons will obtain new insights into the development of product and eventual policies upon the axes along which data was extracted from. Furthermore, we expect the production of model to work beyond the bounds of a Machine Learning product, but as a possibility to draw inferences upon product usage upon.
Such efforts are a short jump start to the long-term reincarnation of Quantifying the Commons.
From Reincarnation onto Baton Touches
The current team would encourage the future team to increase the availability and user experience for our open source data extraction method, via automation and by-batch data extraction methods, for which Dun-Ming has written a design policy for. For modeling, the team also encourage building ingerence pipelines for using ELI5 for Logistic Regression models, as well as experiment more with loss function options of Gradient Boosting Classifier. For Flickr, the writer of this poster would like to suggest some data extraction method outside Flickr API but has access towards Flickr media, say Google Custom Search API.
Additional Reading
- Dun-Ming Huang blogs:
- DSD Fall 2022: Quantifying the Commons (0/10) | by Bransthre | Nov, 2022 | Medium
- DSD Fall 2022: Quantifying the Commons (1/10) | by Bransthre | Nov, 2022 | Medium
- DSD Fall 2022: Quantifying the Commons (2/10) | by Bransthre | Nov, 2022 | Medium
- DSD Fall 2022: Quantifying the Commons (3/10) | by Bransthre | Nov, 2022 | Medium
- DSD Fall 2022: Quantifying the Commons (4/10) | by Bransthre | Nov, 2022 | Medium
- DSD Fall 2022: Quantifying the Commons (5/10) | by Bransthre | Nov, 2022 | Medium
- DSD Fall 2022: Quantifying the Commons (6/10) | by Bransthre | Nov, 2022 | Medium
- DSD Fall 2022: Quantifying the Commons (7A/10) | by Bransthre | Nov, 2022 | Medium
- DSD Fall 2022: Quantifying the Commons (7B/10) | by Bransthre | Nov, 2022 | Medium
- DSD Fall 2022: Quantifying the Commons (8A/10) | by Bransthre | Nov, 2022 | Medium
- DSD Fall 2022: Quantifying the Commons (8B/10) | by Bransthre | Nov, 2022 | Medium
- DSD Fall 2022: Quantifying the Commons (9/10) | by Bransthre | Nov, 2022 | Medium
- DSD Fall 2022: Quantifying the Commons (10/10) | by Bransthre | Nov, 2022 | Medium
- Shuran Yang blog: