ℹ️ 2023-08-31: This project was archived along with the shuttering of CC
Search (now Openverse). Please also see the
Quantifying the Commons
project.
“By visualizing information, we turn it into a landscape that you can explore with your eyes.” – David McCandless.
The landscape of licensed content is wide and varied. We have domains linking to other domains, different license types, and some metadata. This information is extracted from the Internet monthly by Common Crawl. It is fair to mention that we have 250 million works and growing! If you didn't know we had so much licensed content, well then, this is one of the goals of this project: show the users how licensers are connected, their licensed content, and show how the licensing wave is expanding.
Hands to work!
Currently, there are tons of graphs and visualization concepts that have proven to work better with certain data. In addition, because of the huge amount of data we possess, a critical point to keep in mind is that the graph must keep being meaningful (for example, with the classic node-link approach, you can end up having a confusing hairball). Hence, the visualization must be scalable. Finding which visualization would work the best with the CC catalog dataset was my first task. I reviewed the state-of-art in graphs visualization, but in this post I'm not going to go deep with it. The highlights and conclusions of this review are the following:
- Two case studies were reviewed, named Papilio and GeneaQuilts.
- In both cases, data needs to be hierarchical (or have an attribute to use so to order or group the data) .
- Benefits are focused on the analysis tasks that are specific to those use cases (and yes, they are not the same for our case).
- Visualizations are not meaningful when you have thousands of nodes.
- Both cases needed to build a library from scratch.
Conclusion: neither of the solutions reviewed seemed viable for the CC-Catalog visualization project, as they do not show huge improvements in scalability. In addition, they do not fit for our case study.
The graph
Now that I knew what to draw, the next step was to find HOW to draw the graph. There is a wide range of visualization libraries where to choose from, you might feel overwhelmed at first. Tip: define priorities/ key aspects according to what you want to visualize. Performance with big data, community support and a smooth learning curve were the aspects I checked for making a decision. We finally chose to work with force-d3, an open-source library that uses the d3-force module as the underlying physics engine. It has a friendly and simple API, as well as documentation and examples.
One challenging task was to draw the nodes. The idea here is to show the domains names inside the nodes, and let the nodes size to be data driven. Funny fact: I spent hours before finding out that I received nodes as canvas objects with the API. Once you know how to draw nodes, the styling of the edges is a ride, because in force-d3 they are handled in the same way as the nodes objects. The edges are highlighted and their width increases when the user hovers over them. Another not-so-easy feature I implemented was to highlight a node and its neighbors. Here I have to thank to Mr. Vasturiano, the author of the library, who directed me to an example he developed with a very similar functionality. He is continuously checking and fixing open issues in his repo. Great library! I recommend you to check it out.
Licensed content by types of CC licenses
Creative Commons has 6 license types. We know which licenses each domain uses for their content, so it would be great if we can show to the public, for example, the most popular license. The idea is then, to display in a simple graph like a pie chart, the licensed content of each domain, classified by their type. The pie chart will be placed inside a modal. The modal will be triggered and showed after the user clicks on a node in the graph. For this visualization, we are using Highcharts.
The final look of the front-end is:
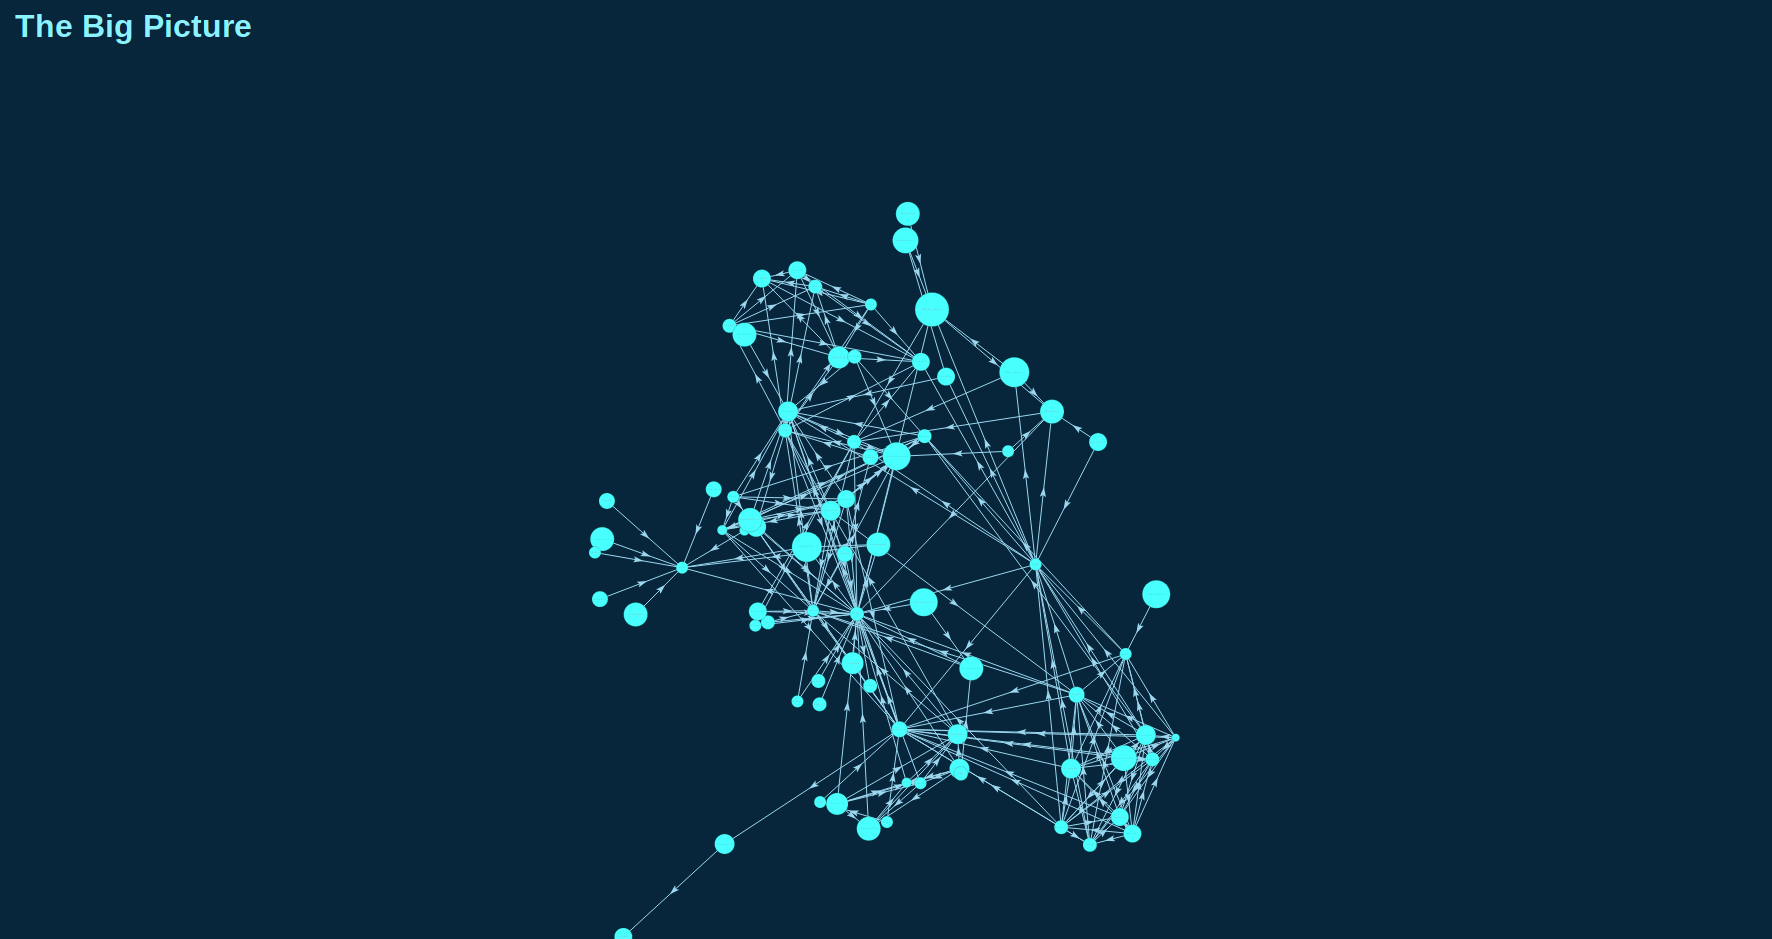 Current sample graph, developed with force-d3.
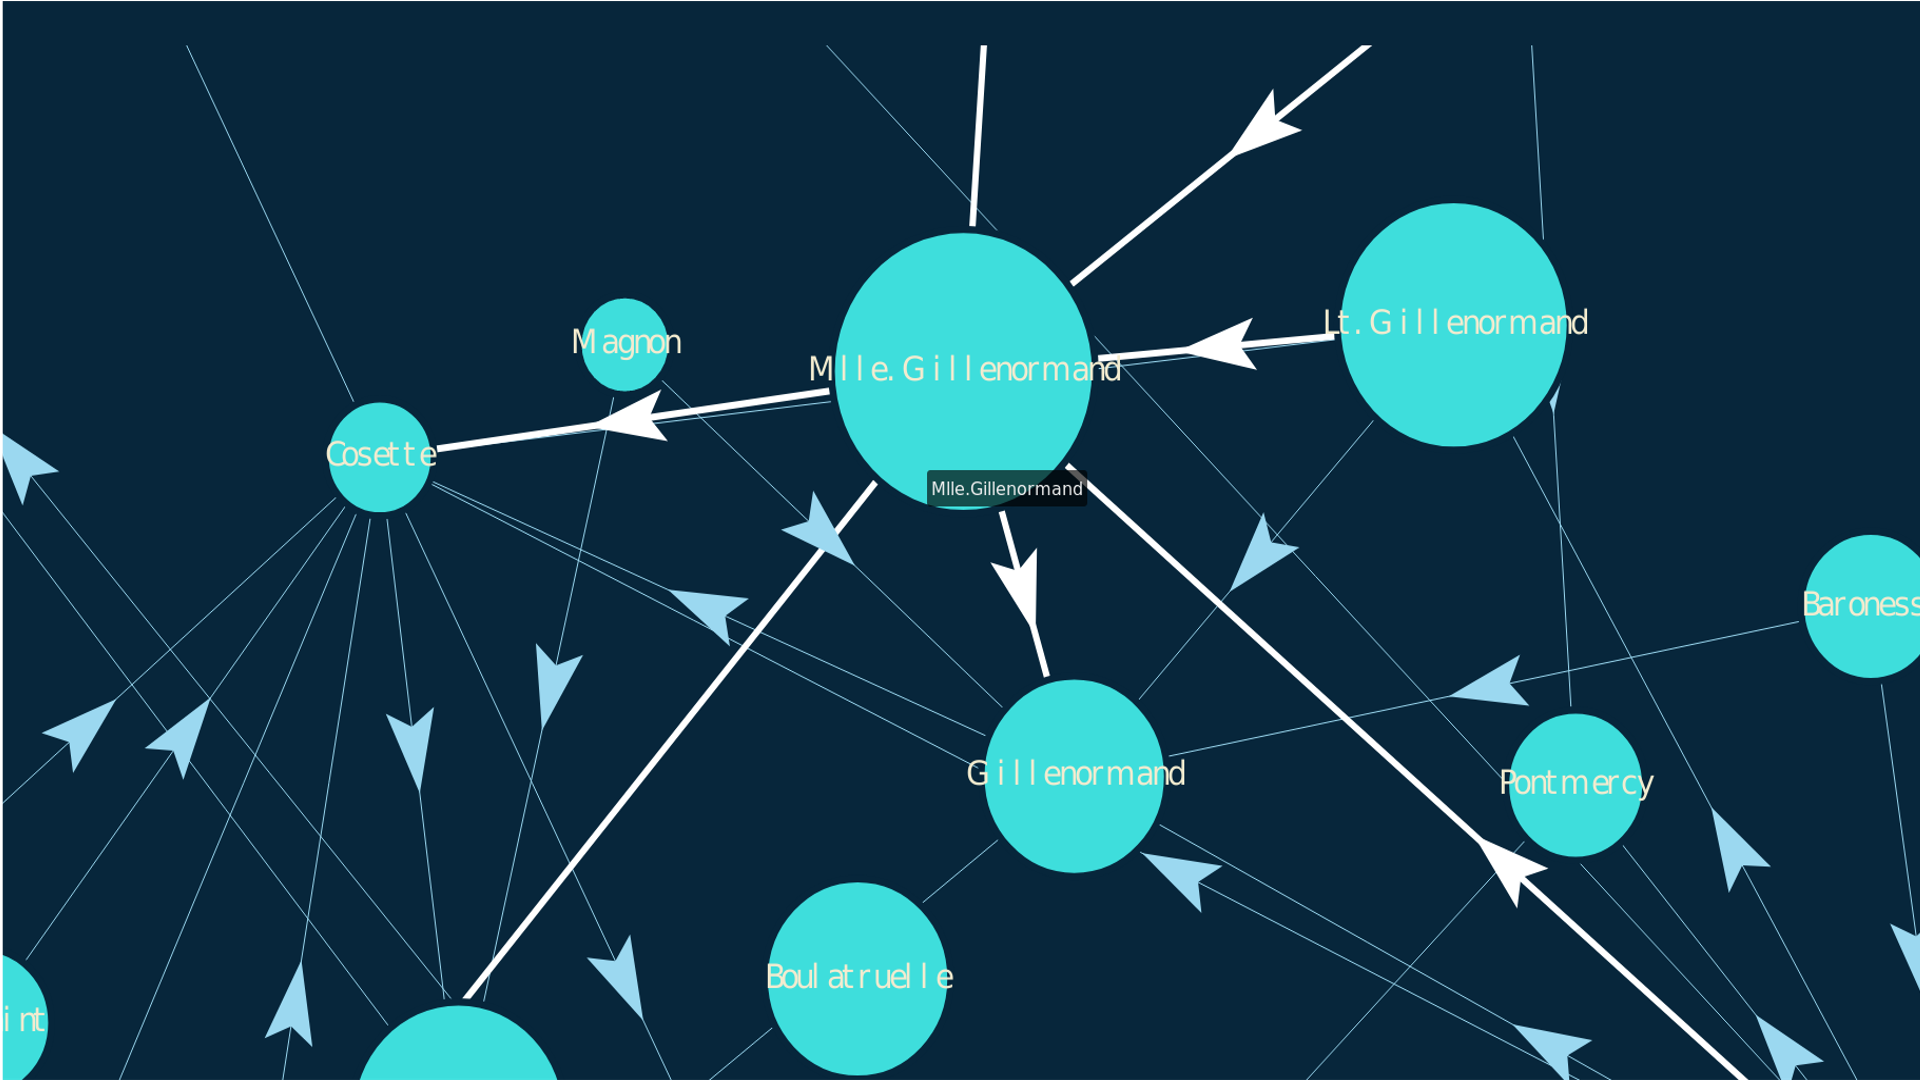 Nodes with sample domain names. When the user hovers over a node, its neighbors are highlighted. The nodes sizes are data-driven.
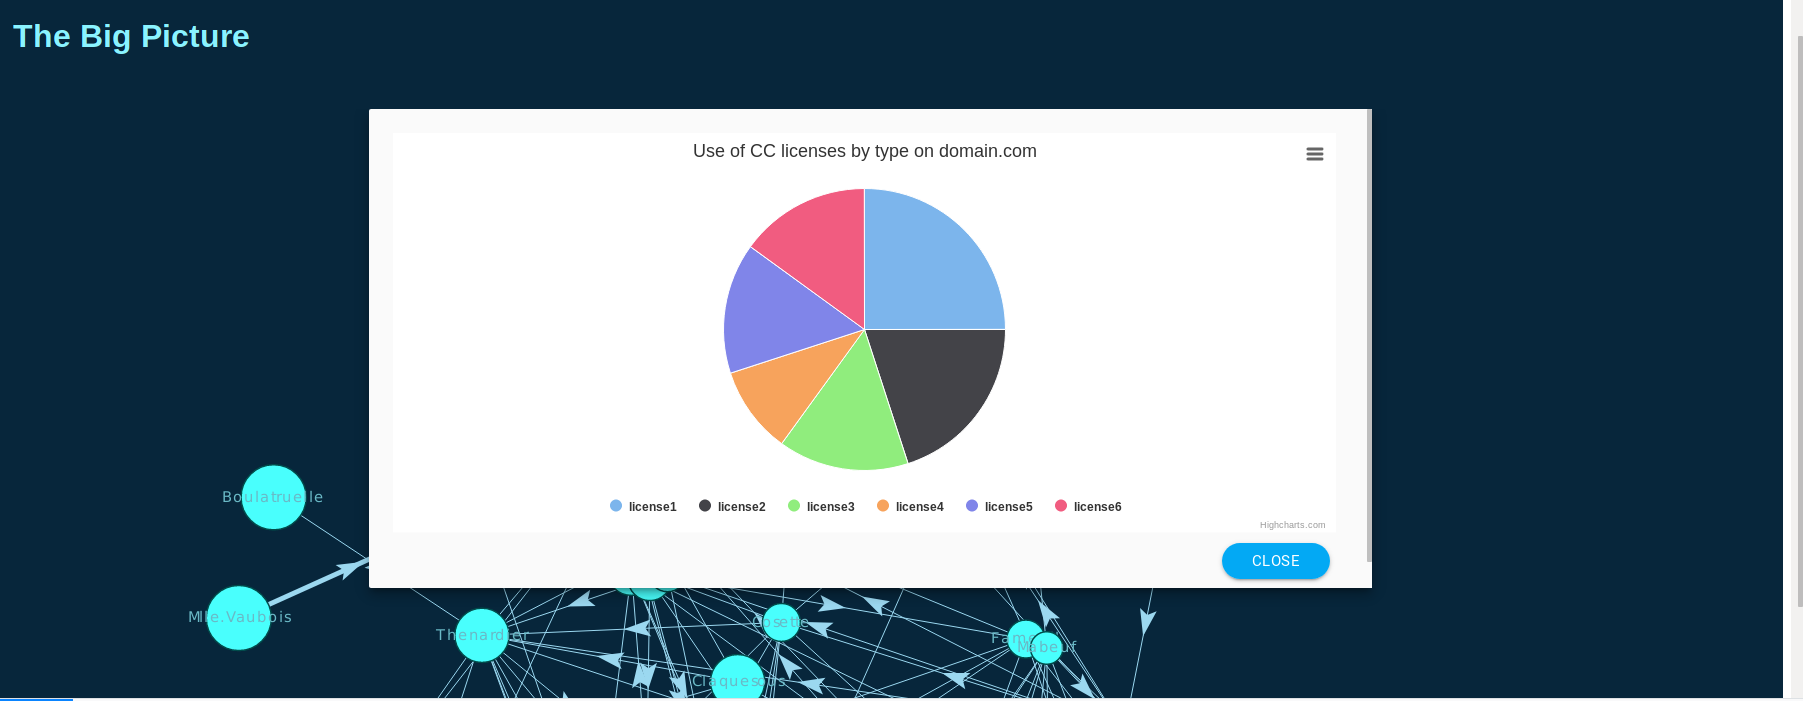 Pie chart that shows the proportions of licensed content of a domain, classified by CC license types.
PD: if the nodes labels are familiar to you, yes, they are the names of the characters of Les Misérables. I'm working with sample data!
Coming soon
As the front-end is complete, I am going to get my hands dirty with the data. Future milestones for the next two weeks include:
- Files conversion in Spark
- Reviewing of part of the dataset
- Implementation of a module for cleaning and parsing the data
You can follow the project development in the Github repo.
CC Data Catalog Visualization is my GSoC 2019 project under the guidance of Sophine
Clachar, who has been greatly helpful and considerate since the GSoC application period. Also, my backup mentor, Breno Ferreira, and engineering director Kriti
Godey, have been very supportive.
Have a nice week!
Maria